
Anatomy of a Recession Long View: 2022--The Year of Transition
Key Takeaways
- We expect more volatile equity markets with more muted returns than the last two years as the macro environment undergoes a shift in terms of phase of the economic cycle, the pandemic, monetary policy and fiscal stimulus.
- Inflation will likely get worse over the next few months as easy comparisons from a year ago are lapped but should improve later in 2022 when comparisons become more challenging. Despite an unprecedented set of reasons for prices to soar, longer-term inflation expectations remain muted.
- Although the current cycle could run hotter and shorter than past recoveries, the near-term prospects for a recession remain muted. Despite two negative indicator changes, the ClearBridge Recession Risk Dashboard continues to flash an overall green signal.
Visit the Anatomy of a Recession page on Envestnet Institute to see more macroeconomic content from Franklin Templeton & ClearBridge Investments
Maturing of Economy and Market Could Be Bumpy
The investment community’s word of the year for 2020 was undoubtedly “unprecedented” following the deep pandemic-induced recession and the unparalleled policy response that followed. “Transitory” would be our submission for the word of 2021, with central bankers (and us) underestimating the current inflationary impulse. As we look ahead to 2022, “resilience” could be a frontrunner for word of the year, as virus disruptions hopefully become less frequent. However, we believe “transition” may actually best encapsulate 2022, as the macro environment undergoes a shift in terms of phase of the economic cycle, the pandemic, monetary policy, fiscal stimulus, inflation and financial markets. While transitions can sometimes be a little bumpy, they are normal and typically signal a maturing economic and market cycle.
The economic transition from early to mid-cycle is ongoing, with real GDP growth and job creation coming off a boil from 2021 peak levels. Although growth will decline in the coming year, consensus expectations are for a still-robust 3.9% increase in real GDP, a level better than any single year in the decade following the Global Financial Crisis. Currently, the economy is expected to move toward its pre-pandemic trend in 2023, with GDP slowing further to 2.5% and job creation poised to fall toward the 175,000 per month range. While this normalization is a positive development, the slack created by the recession is being absorbed much faster than usual. For example, the time it took for earnings per share (EPS) to recover to the prior peak this cycle was much shorter compared to the last several recessions. Given that the length of the EPS recovery and the overall economic expansion appear to be related, the current expansion could be shorter than the 8.5-year average seen over the last four cycles.
Exhibit 1: Speedy Recovery, Shorter Expansion

Data as of Nov. 30, 2021, latest available as of Dec. 31, 2021. Source: Bloomberg, National Bureau of Economic Research.
Although the potential for a more truncated and hotter economic cycle exists, near-term prospects for a recession remain muted. At present, the ClearBridge Recession Risk Dashboard continues to flash a robust overall green expansion signal. The dashboard, however, has experienced some minor deterioration this quarter with Wage Growth turning red and Money Supply declining to yellow. While having some color in the dashboard is a departure from recent quarters, recession risks remain low despite the recent outbreak of Omicron. For example, the Atlanta Fed’s GDPNow is currently tracking to 7.4% real GDP for the fourth quarter, much higher than at any point during the third quarter’s Delta-related disruption. Omicron will likely take down the current GDPNow estimate, but while the economy may bend, it shouldn’t break. Furthermore, most recent data suggest Omicron is more contagious but less deadly than previous variants, which could be important as we transition from pandemic to endemic. This shift will not be costless, but it should be positive for risk assets as the necessity for additional social distancing measures and restrictions diminishes.
Exhibit 2: ClearBridge Recession Risk Dashboard

Data as of Dec. 31, 2021. Source: BLS, Federal Reserve, Census Bureau, ISM, BEA, American Chemistry Council, American Trucking Association, Conference Board, and Bloomberg. The ClearBridge Recession Risk Dashboard was created in January 2016. References to the signals it would have sent in the years prior to January 2016 are based on how the underlying data was reflected in the component indicators at the time.
The key macro debate for financial markets over the past 18 months has been inflation. Unfortunately, inflation will likely get worse over the next few months as easy comparisons from a year ago are lapped, although it should start to improve later in 2022 when comparisons become more challenging. There is more to the inflationary impulse than just comps, and by understanding the drivers of inflation one can better assess the path forward. Much of the excess inflation has been coming from used cars and other goods (ex-used cars), largely driven by shifting consumer preferences during the pandemic (services to goods) and compounded by supply chain constraints. As consumer preferences normalize during the transition to endemic, and as supply chain pressures abate, so too should inflation. From a historical perspective, core CPI has run at 4.9% over the last 12 months, which is 3.1% above the average 1.8% pace over the prior decade (2010–2019). Four categories of goods that combined make up 14% of the overall CPI basket accounted for almost two-thirds of the increase: new cars, used cars/trucks, apparel and household furnishings.
Exhibit 3: What’s Driving Inflation

OER stands for Owners Equivalent Rent, the amount of rent that would have to be paid in order to substitute a currently owned house as a rental property. Data as of Nov. 30, 2021, latest available as of Dec. 31, 2021. Source: BLS, Bloomberg.
Furthermore, since the turn of the century, more than 100% of core CPI has come from services1, with negative contribution from goods in large part due to globalization keeping goods prices low. Even though services inflation has recently ticked higher, it remains broadly consistent with longer-term trends. For a persistently higher inflationary backdrop to emerge, however, goods prices would have to continue to rise. While there has been ample ink spilled about de-globalization, the data suggest a stall, not a reversal. This means as we transition from pandemic to endemic, a transition back to slower inflation should also occur, given the lack of a goods price regime shift.
Exhibit 4: Goods Inflation Regime Shift?

Data as of Nov. 30, 2021, latest available as of Dec 31, 2021. Source: BLS and Bloomberg.
One of the best ways to determine how the market views long-term inflation is through the lens of five-year, five-years forward breakevens (the pricing of five-year inflation expectations five years from now). This metric has been right in the middle of its trading range from the last decade, which means the market doesn’t expect (and has never expected) a meaningful transition in inflation over the long term. If a global pandemic, unprecedented fiscal and monetary expansion, countless supply chain disruptions, and 6%+ CPI readings can’t get the market to reprice inflation over the longer term, it’s hard to see what could lead to a shift in expectations. That said, our view is that inflationary pressure will begin to moderate in a few quarters and transition toward the Fed’s 2% target over the next few years.
Exhibit 5: Long Term Inflation Not a Concern

Five year period represents period from Jan. 2022 – Jan. 2027; five years forward represents period from Jan. 2027 – Jan. 2032. Data as of Dec. 31, 2021. Source: FactSet.
Another transition that has already begun and will continue in 2022 is the end of unbounded fiscal and monetary policy. The Fed is slowing QE purchases and has signaled that rate hikes may begin in the coming months. With inflation running well above target for longer than any expected, this hawkish turn makes sense. This shift also allows flexibility: should inflation begin to cool in the spring, the Fed can still shift its focus back toward the full employment half of its dual mandate and adopt a softer tone with regard to the timing of interest rate hikes. Currently, futures markets imply three rate hikes in 2022, and while more could occur, the markets are already expecting considerable monetary tightening in the year ahead. Despite this, history suggests that the initial rate hike could lead to near-term volatility in equity markets and a period of sideways price action.
Exhibit 6: Fed Liftoff, Market Breather

Source: FactSet. Data as of Dec. 31, 2021.
The ongoing saga of the Build Back Better (BBB) bill speaks to the transition on the fiscal policy side — compare the speed and ease with which the $1.9 trillion American Rescue Plan was passed in March 2021. The size of BBB has already been reduced several times amid a diminishing appetite for more fiscal support in a strong growth environment with above-target inflation. As a result, many investors are worried about the “fiscal cliff.” These fears appear overblown for several reasons. Much of the fiscal impulse in 2021 was focused toward income replacement, which is less necessary given the subsequent labor market recovery. Further, there is a very strong relationship between what workers earn and what they spend. With aggregate payrolls (hours worked × wages, at an aggregate level) well above the long-term average and easily outpacing inflation, workers have the means to continue spending in a healthy manner. This suggests that consumption, the backbone of the American economy, should hold up even in the face of waning fiscal support in 2022.
Fiscal cliff fears also assume that the entire increase in public deficits was spent and this year’s deficit reduction results in a GDP drag. While that may typically be the case, many households saved a portion of their transfer payments, as evidenced by the jump in savings rates in 2020. Although savings rates have normalized, there remains over $2 trillion in accumulated savings stockpiled, which could fund future spending. Finally, while the prospects may look bleak, a path forward for BBB has recently emerged. Taken together, the 2022 fiscal cliff may be more bark than bite.
Exhibit 7: Consumer Outlook Dependent on Wages

Data as of Nov. 30, 2021, latest available as of Dec. 31, 2021. Source: BLS, BEA, and Bloomberg.
Earnings Key as Equities Face More Resistance
Given all these changes, gains in equity markets in the year ahead appear likely to come against a more labored backdrop with the potential for larger drawdowns. This dynamic is not uncommon during the transition to mid-cycle following the initial recovery, a similar backdrop seen in 1994 and 2011. The headwind for equities appears more likely to be multiples, with a healthy 8.5% consensus expectation for earnings growth in the year ahead and continued positive revisions to earnings estimates in recent months. Modest multiple compression is typical during this part of a new economic expansion, a dynamic we highlighted one year ago. P/Es did compress in 2021, and we believe further compression may occur in 2022 for similar reasons.
The good news is that earnings growth appears robust enough that the outlook for stocks on a full-year basis is solid, even though bouts of volatility may emerge. One thing that should support markets in the near term is retail participation in the market, which saw $913 billion in global equity inflows through the first 11 months of 2021.2 This is over 5x the $179 billion cumulative inflows seen since 1996.3 Importantly, January tends to be the strongest month for inflows, suggesting near-term volatility may remain muted before picking up later in 2022.
Exhibit 8: Retail Put

As of Nov. 30, 2021, latest available as of Dec. 31, 2021. Source: Goldman Sachs.
Another transition that could lead to market choppiness later in 2022 is the potential for a leadership shift in Washington. Historically, midterm election years see the largest intra-year drawdowns of any of the four years of a presidential cycle with an average decline of -19%. Although the midterms remain a distant thought for now, as the primaries edge closer and investors recalibrate expectations around potential legislative actions, this could become a source of volatility. Importantly, these pullbacks have historically been buying opportunities for longer-term investors, with a +32% rally on average in the year following the troughs of the midterm year drawdown.
Exhibit 9: Midterm Elections

Source: Standard & Poor’s, Bloomberg.
While 2022’s returns may pale in comparison to the outsized run the market has seen from the March 2020 pandemic lows, conditions remain supportive for further upside in equities in the years to come. Financial conditions remain accommodative and, though the Fed has become more hawkish, policy still remains quite easy compared with history. The U.S. economy has proven surprisingly resilient, and as subsequent variants hopefully become less disruptive, the healthy consumer, strong labor market and robust earnings backdrop should shine through. Taken together, the backdrop for corporate profits appears healthy enough to more than offset modest multiple compression and should drive another year of positive equity returns. Transitions are periods of change and while change can be unsettling, it is often both necessary and healthy. Consequently, financial markets may be choppier than recent history but should work their way higher as we move through this transition into the middle innings of this cycle.
ENDNOTES
-
Source: ClearBridge Investments.
-
Source: Goldman Sachs.
-
Source: Ibid.
Definitions
The ClearBridge Recession Risk Dashboard is a group of 12 indicators that examine the health of the U.S. economy and the likelihood of a downturn.
Gross Domestic Product (GDP) is an economic statistic which measures the market value of all final goods and services produced within a country in a given period of time.
The GDPNow model forecasts GDP growth by aggregating 13 subcomponents that make up GDP with the chain-weighting methodology used by the U.S. Bureau of Economic Analysis (BEA).
The S&P 500 Index is an unmanaged index of 500 stocks that is generally representative of the performance of larger companies in the U.S.
The Federal Reserve Board ("Fed") is responsible for the formulation of U.S. policies designed to promote economic growth, full employment, stable prices, and a sustainable pattern of international trade and payments.
Earnings per share (EPS) is the portion of a company's profit allocated to each outstanding share of common stock. An index EPS is an aggregation of the EPS of its component companies.
Global Financial Crisis refers to the economic disruption that followed the collapse of prominent investment banks in 2007-8, marked by a general loss of liquidity in the credit markets and declines in stock prices.
The Bureau of Economic Analysis (BEA) is an agency of the Department of Commerce that produces economic accounts statistics that enable government and business decision-makers, researchers, and the American public to follow and understand the performance of the Nation's economy. To do this, BEA collects source data, conducts research and analysis, develops and implements estimation methodologies, and disseminates statistics to the public.
The Core Consumer Price Index (Core CPI) excludes the prices of food and energy, which are volatile on a monthly basis, from the basket of goods used to determine the CPI.
WHAT ARE THE RISKS?
Past performance is no guarantee of future results. Please note that an investor cannot invest directly in an index. Unmanaged index returns do not reflect any fees, expenses or sales charges.
Equity securities are subject to price fluctuation and possible loss of principal. Fixed-income securities involve interest rate, credit, inflation and reinvestment risks; and possible loss of principal. As interest rates rise, the value of fixed income securities falls. International investments are subject to special risks including currency fluctuations, social, economic and political uncertainties, which could increase volatility. These risks are magnified in emerging markets. Commodities and currencies contain heightened risk that include market, political, regulatory, and natural conditions and may not be suitable for all investors.
U.S. Treasuries are direct debt obligations issued and backed by the “full faith and credit” of the U.S. government. The U.S. government guarantees the principal and interest payments on U.S. Treasuries when the securities are held to maturity. Unlike U.S. Treasuries, debt securities issued by the federal agencies and instrumentalities and related investments may or may not be backed by the full faith and credit of the U.S. government. Even when the U.S. government guarantees principal and interest payments on securities, this guarantee does not apply to losses resulting from declines in the market value of these securities.
IMPORTANT LEGAL INFORMATION
This material is intended to be of general interest only and should not be construed as individual investment advice or a recommendation or solicitation to buy, sell or hold any security or to adopt any investment strategy. It does not constitute legal or tax advice.
The views expressed are those of the investment manager and the comments, opinions and analyses are rendered as at publication date and may change without notice. The information provided in this material is not intended as a complete analysis of every material fact regarding any country, region or market. All investments involve risks, including possible loss of principal.
Data from third party sources may have been used in the preparation of this material and Franklin Templeton ("FT") has not independently verified, validated or audited such data. FT accepts no liability whatsoever for any loss arising from use of this information and reliance upon the comments opinions and analyses in the material is at the sole discretion of the user.
Products, services and information may not be available in all jurisdictions and are offered outside the U.S. by other FT affiliates and/or their distributors as local laws and regulation permits. Please consult your own financial professional or Franklin Templeton institutional contact for further information on availability of products and services in your jurisdiction.
Issued in the U.S. by Franklin Templeton Distributors, Inc., One Franklin Parkway, San Mateo, California 94403-1906, (800) DIAL BEN/342-5236, franklintempleton.com - Franklin Templeton Distributors, Inc. is the principal distributor of Franklin Templeton U.S. registered products, which are not FDIC insured; may lose value; and are not bank guaranteed and are available only in jurisdictions where an offer or solicitation of such products is permitted under applicable laws and regulation.
You need Adobe Acrobat Reader to view and print PDF documents. Download a free version from Adobe's website.
Franklin Templeton Distributors, Inc.

Anatomy of a Recession Update: Cracks in the Foundation
Get perspective on the most recent US economic data, the investor’s view, and how reviewing previous recessionary periods may help us today, in this conversation with Jeff Schulze, Head of Economic and Market Research at ClearBridge Investments.

AOR Update: When to expect a recession?
ClearBridge Investments: Despite improving economic sentiment now leaning the consensus view toward a soft landing, we continue to believe a recession is on the horizon.
Anatomy of a Recession: Economic and Market Outlook 3Q 2023 | August 1st
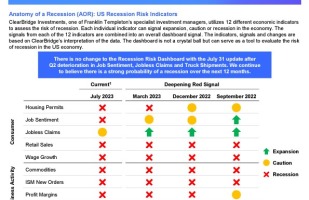
ClearBridge Investments, one of Franklin Templeton’s specialist investment managers, utilizes 12 different economic indicators to assess the risk of recession.