
Follow
How Equities Historically Have Performed After a Fed Pause
The Federal Reserve’s decision to hit pause on a rate hike this month may change the complexion of the outlook for some investors. To better understand how a pause may affect equity performance, we examined U.S. returns around the last six times the Fed paused rate hikes from 1984 to 2018. On average, U.S. stocks performed well after a Fed pause while value outperformed growth.
Historical Market Performance Before the Fed Pauses
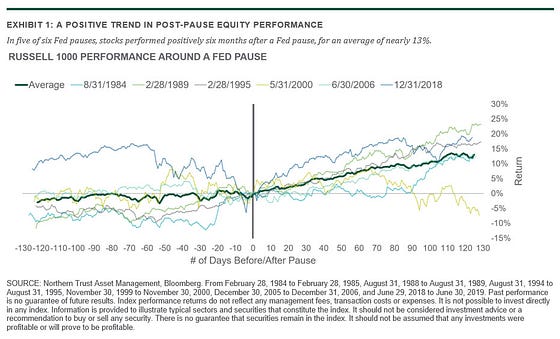
Stocks represented by the Russell 1000 Index exhibited positive performance on average during the months leading up to the Fed pauses we studied (see Exhibit 1). We don’t find that surprising. During the pre-pause periods, markets benefited from the perception of strong economic growth. After all, the Fed often was raising rates to try to rein in growth that it saw as too strong.
Patterns of returns varied somewhat over three-month versus six-month periods. Three-month market returns before a Fed pause averaged about 2.5%, and they were positive in four out of six periods. Six-month returns before a Fed pause averaged just under 4%, and they were positive in five out of six periods.
During these six periods, we also noticed something that might seem familiar to today’s investors. Near the end of the tightening cycle, investors have historically shifted toward defensive stocks as they started to see the impact of earlier hikes slowing economic growth and affecting corporate earnings.
Historical Market Performance After Fed Pauses
Similar to the pre-pause periods, markets generally delivered positive returns following Fed pauses. The scale of positive returns was even greater during the post-pause period. On average, during the three-month periods following a Fed pause, stocks rose 8% and were positive in five out of six periods. Averages increased by even more — just under 13% — during the six-month periods following a pause and were positive in five out of six periods.
The post-pause pattern of average sector returns over three- and six-month periods shows some interesting patterns with implications for investors. During the first three months following a Fed pause, information technology outperformed — thanks to euphoria about the pause — along with utilities.
The post-pause six-month average performance shows a dramatic reversal for information technology, with performance favoring defensive sectors led by consumer staples and followed by utilities and health care. We also found that six months out value outperformed growth, higher quality (high return on capital, strong cash flow) outperformed lower quality, and low volatility stocks outperformed high volatility stocks (see Exhibit 2).

Practical Implications of Historical Patterns
Average patterns of market returns pre- and post-pause shows that equity factors — high dividend, low volatility, high quality, momentum value and small cap stocks — have historically delivered good relative returns through these transitions. Of course, with only six events, there was a wide dispersion of historical outcomes, reflecting the economic environments specific to those events. There’s no certainty that the coming year’s patterns will stick closely to the historical averages. However, a multifactor strategy, combining the equity factors listed above, may help by smoothing the volatility of individual factors, particularly considering the high dispersion in factor performance over the periods studied.
See our latest insights and research.
IMPORTANT INFORMATION
For Asia-Pacific markets, this information is directed to institutional, professional and wholesale clients or investors only and should not be relied upon by retail clients or investors. The information contained herein is intended for use with current or prospective clients of Northern Trust Investments, Inc (NTI) or its affiliates. The information is not intended for distribution or use by any person in any jurisdiction where such distribution would be contrary to local law or regulation. Northern Trust Asset Management’s (NTAM) and its affiliates may have positions in and may effect transactions in the markets, contracts and related investments different than described in this information. This information is obtained from sources believed to be reliable, its accuracy and completeness are not guaranteed, and is subject to change. Information does not constitute a recommendation of any investment strategy, is not intended as investment advice and does not take into account all the circumstances of each investor.
This report is provided for informational purposes only and is not intended to be, and should not be construed as, an offer, solicitation or recommendation with respect to any transaction and should not be treated as legal advice, investment advice or tax advice. Recipients should not rely upon this information as a substitute for obtaining specific legal or tax advice from their own professional legal or tax advisors. References to specific securities and their issuers are for illustrative purposes only and are not intended and should not be interpreted as recommendations to purchase or sell such securities. Indices and trademarks are the property of their respective owners. Information is subject to change based on market or other conditions.
All securities investing and trading activities risk the loss of capital. Each portfolio is subject to substantial risks including market risks, strategy risks, advisor risk, and risks with respect to its investment in other structures. There can be no assurance that any portfolio investment objectives will be achieved, or that any investment will achieve profits or avoid incurring substantial losses. No investment strategy or risk management technique can guarantee returns or eliminate risk in any market environment. Risk controls and models do not promise any level of performance or guarantee against loss of principal. Any discussion of risk management is intended to describe NTAM’s efforts to monitor and manage risk but does not imply low risk.
Past performance is not a guarantee of future results. Performance returns and the principal value of an investment will fluctuate. Performance returns contained herein are subject to revision by NTAM. Comparative indices shown are provided as an indication of the performance of a particular segment of the capital markets and/or alternative strategies in general. Index performance returns do not reflect any management fees, transaction costs or expenses. It is not possible to invest directly in any index. Net performance returns are reduced by investment management fees and other expenses relating to the management of the account. Gross performance returns contained herein include reinvestment of dividends and other earnings, transaction costs, and all fees and expenses other than investment management fees, unless indicated otherwise. For additional information on fees, please refer to Part 2a of the Form ADV or consult an NTI representative.
Forward-looking statements and assumptions are NTAM’s current estimates or expectations of future events or future results based upon proprietary research and should not be construed as an estimate or promise of results that a portfolio may achieve. Actual results could differ materially from the results indicated by this information.
Hypothetical portfolio information provided does not represent results of an actual investment portfolio but reflects representative historical performance of the strategies, funds or accounts listed herein, which were selected with the benefit of hindsight. Hypothetical performance results do not reflect actual trading. No representation is being made that any portfolio will achieve a performance record similar to that shown. A hypothetical investment does not necessarily take into account the fees, risks, economic or market factors/conditions an investor might experience in actual trading. Hypothetical results may have under- or over-compensation for the impact, if any, of certain market factors such as lack of liquidity, economic or market factors/conditions. The investment returns of other clients may differ materially from the portfolio portrayed. There are numerous other factors related to the markets in general or to the implementation of any specific program that cannot be fully accounted for in the preparation of hypothetical performance results. The information is confidential and may not be duplicated in any form or disseminated without the prior consent of NTAM.
This information is intended for purposes of NTI and/or its affiliates marketing as providers of the products and services described herein and not to provide any fiduciary investment advice within the meaning of Section 3(21) of the Employee Retirement Income Security Act of 1974, as amended (ERISA). NTI and/or its affiliates are not undertaking to provide impartial investment advice or give advice in a fiduciary capacity to the recipient of these materials, which are for marketing purposes and are not intended to serve as a primary basis for investment decisions. NTI and its affiliates receive fees and other compensation in connection with the products and services described herein as well as for custody, fund administration, transfer agent, investment operations outsourcing and other services rendered to various proprietary and third party investment products and firms that may be the subject of or become associated with the services described herein.
Northern Trust Asset Management is composed of Northern Trust Investments, Inc. Northern Trust Global Investments Limited, Northern Trust Fund Managers (Ireland) Limited, Northern Trust Global Investments Japan, K.K, NT Global Advisors, Inc., 50 South Capital Advisors, LLC, Northern Trust Asset Management Australia Pty Ltd, and investment personnel of The Northern Trust Company of Hong Kong Limited and The Northern Trust Company.
NOT FDIC INSURED | MAY LOSE VALUE | NO BANK GUARANTEE
© 2023 Northern Trust Corporation. Head Office: 50 South La Salle Street, Chicago, Illinois 60603 U.S.A.