
How Will Your Assets Perform in the Next Phase?
KEY INSIGHTS
- We analyzed the performance of various asset classes across five economic phases: recovery, expansion, slowdown, downturn (not recessionary), and downturn (recessionary).
- Our analysis shows that stocks outperformed high yield bonds across all economic phases and that risk products generally performed most strongly during the recovery phase.
- Currencies performed most strongly during the expansion phase, while U.S. government bonds and gold delivered positive returns across all phases.
Financial assets perform differently in different phases of the economic cycle. Consequently, investors will likely adjust their portfolios over time in accordance with changing circumstances and expectations. This requires making assumptions about how individual assets will perform at different stages of the cycle. But how can we be sure these assumptions are correct—and which assets are needed to meet individual changes given the economic outlook?
With the global economy under significant and unprecedented pressure arising from the coronavirus pandemic and financial assets experiencing heightened volatility, we looked for historical patterns of cyclical performance that may provide a guide for prospects for individual asset classes.
Understanding Historical Patterns of Asset Class Performance Across an Economic Cycle
To determine how assets have performed historically in different phases of the economic cycle, we defined the economic cycle using the US Institute for Supply Management (ISM) Manufacturing PMI Index from 1960. We smoothed the return series by using a symmetrical moving average1 and broke it down into five economic phases: recovery, expansion, slowdown, downturn (not recessionary), and downturn (recessionary) (see Figure 1). We divided the downturn category into not recessionary and recessionary downturns to examine the differences in performance of assets based on the severity of the slowdown. We defined each phase as follows:
- Recovery: From when the ISM begins to move up from a trough
- Expansion: From when the ISM rises above 52 and continues upward
- Slowdown: From when the ISM begins to fall from a peak to around 52
- Downturn (recessionary and not recessionary): From when the ISM falls below 52 and continues downward
(Fig. 1) The US ISM Manufacturing PMI Index, March 1960 to May 2020

PMI = Purchasing Managers Index.
Source: Institute for Supply Management/Haver Analytics.
For performance within each phase, we used the month‑on‑month return (i.e., a month’s return compared to the previous month) of the following asset classes and indices in each of those phases: the S&P 500 Total Return Index, 10-Year Treasury Note Constant Maturity Total Return Index and Three-Year Treasury Note Constant Maturity Total Return Index, industrial metals, gold, investment‑grade excess return, high yield excess return, emerging market currencies, and developed markets currencies.2 Finally, we aggregated the performance of each asset class to determine its mean annualized return in each phase of the economic cycle.
"The S&P 500 Index outperformed high yield excess returns in each economic phase..."
Figure 2 shows the performance trajectories of each of the asset classes across their full history. As the data available for each asset class cover different time periods, each asset class is shown in a separate chart. The important point these charts demonstrate is how each asset has historically performed at each stage of the economic cycle.
Asset Classes Compared—Pinpointing Trends Across the Same Time Frame
For a more direct comparison of asset class performance trends, it is necessary to review the data over common time periods. Figure 3 compares the performance of several assets from August 1988 to May 2020. It shows that:
ASSET CLASS PERFORMANCE VARIED WIDELY DURING DIFFERENT PHASES
(Fig. 2) How stocks, credit, metals, U.S. government bonds, and gold performed over time

Past performance is not a reliable indicator of future performance.
1 The excess returns are to U.S. Government Bonds.
- The S&P 500 Index outperformed high yield excess returns in each economic phase, including recessions. This probably will come as a surprise to anybody who experienced the major S&P 500 drawdowns of 2002 and 2008–2009. However, a closer look at the performance of the S&P 500 shows that its performance in recent recessions has been very poor by historic standards and that over the longer term, recessions have had a less severe impact on the S&P 500 Index.3
- Risk investments such as stocks (S&P 500), investment grade, and high yield performed best in the recovery phase.
- Metals performed best in the expansion phase—suggesting that industrial metals are impacted more by real economic activity than expectations.
"Emerging market currencies typically benefit from carry and delivered their best returns during the expansion phase."
- High yield and investment‑grade credit excess returns were negative in downturns irrespective of whether they were recessionary or not. However, the S&P 500 return in a not recessionary downturn was positive.
- Investment‑grade credit was the only asset class out of the four with negative returns during the slowdown and downturn phases.
THE S&P 500 OUTPERFORMED HIGH YIELD ACROSS ALL ECONOMIC PHASES
(Fig. 3) Equities, credit, and industrial metals, August 1988 to May 2020

Past performance is not a reliable indicator of future performance.
Sources: Bloomberg Finance L.P., Standard & Poor’s, and Commodity Research Bureau/Haver Analytics.
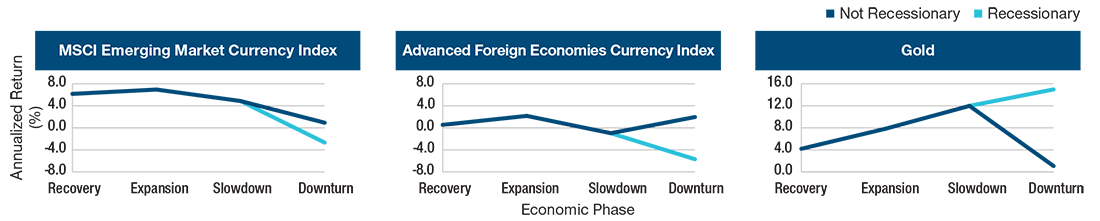
Figure 4 illustrates the performance of gold and currencies from November 1997 to May 2020.
Emerging market currencies typically benefit from carry4 and delivered their best returns during the expansion phase. They also delivered positive returns in all stages apart from recessionary downturns. These positive returns were due to carry as spot returns were close to zero, or negative in some cases.
EMERGING MARKET CURRENCY PERFORMANCE WAS DRIVEN BY “CARRY” EFFECT
(Fig. 4) Currencies and gold, November 1997 to May 2020
Past performance is not a reliable indicator of future performance.
Sources: Bloomberg Finance L.P. and Federal Reserve Board/Haver Analytics.
In advanced economy foreign exchange, carry is less important and so is excluded from our analysis. Like emerging market currencies, advanced economy currencies performed best during the expansion phase of the cycle. There was a clear distinction between returns for advanced economy currencies in recessionary and not recessionary downturns, indicating that advanced economy currencies performed positively in a less severe U.S. downturn but not if there was a recession.
Gold delivered positive returns during all phases and performed best during the recessionary downturn. It is notable that gold’s worst performance was in the not recessionary downturn, indicating that the severity of the slowdown was a key determinant in its performance.
U.S. TREASURIES AND GOLD DELIVERED POSITIVE RETURNS ACROSS THE CYCLE
(Fig. 5) Government bonds and gold, January 1970 to May 2020

Past performance is not a reliable indicator of future performance.
Sources: Bloomberg Finance L.P. and U.S. Treasury/Haver Analytics.
Figure 5 illustrates the performance of gold and U.S. government bonds from January 1970 to May 2020. Like gold, government bonds delivered positive performance during all phases of the economic cycle due to the very long bull market in fixed income. It is noteworthy that recovery was not the worst phase for government bonds even though it was the best phase for the S&P 500. Perhaps most surprising is the stronger performance of U.S. 10‑year total returns in downturns that were not recessionary versus downturns which were recessionary. While gold performed better than government bonds during the slowdown phase, bonds performed more strongly during the downturn phase.
Positioning for the Recovery
There is currently a high degree of uncertainty over the global economy. There is no clear indication of when the coronavirus will end, or its long‑term impact on markets. At present, we are in the downturn (recessionary) phase of the economic cycle, but it is difficult to know how long this will last or how quickly markets will recover when it ends. The picture should become clearer over the coming weeks and months. When it does, understanding which assets are likely to perform best in the next phase of the economic cycle will likely make a significant difference to portfolio performance.
As economies begin to open up, we will likely enter the recovery phase of the economic cycle. This phase has traditionally been the best for risk assets, indicating potential allocations in U.S. stocks over high yield and investment‑grade credit. Emerging market currencies also performed strongly in this phase in our analysis. However, allocations in advanced market currencies should likely be delayed as returns were notably higher in the expansion phase. This should potentially coincide with a rotation out of government bonds and gold, which we would expect to enter a period of lower returns compared with the downturn (recessionary) phase. The analysis also indicates that significant allocations in industrial metals would likely be premature given that metals performed significantly better in the expansion phase.
We believe the analysis and the results should help provide a foundation for decision‑making, which can be supplemented with the assessment of valuations and technicals for each asset class. However, the situation remains uncertain, so we are watching closely for further developments in the impact of the coronavirus and the responses from central banks and governments.
WHAT WE’RE WATCHING NEXT
As the impact of the coronavirus is felt by economies across the world over the next few months, we will be monitoring developments closely for signs for when the next phase of the economic cycle is likely to begin. This may not become apparent for a while yet, but the next phase will bring risks and opportunities, and we believe it will be important to act quickly to position portfolios accordingly.
1 We use a five-month symmetrical moving average. We calculate this by taking an average of the previous two months, the current month and the two months ahead. This is done in order to reduce the volatility in the PMI series and improve the consistency of the signal. The limitation of this approach is that it cannot be calculated in real-time as it requires future data. However, it is suitable in the current analysis as we are looking at understanding the historical performance of assets in different phases of the cycle, Moving averages help identify trends in the data. It does not reflect shorter term volatility. Symmetric moving average cannot be calculated in real time as it includes forward returns.
2 Industrial metals uses the Commodity Research Bureau Spot Metals Index; gold uses the Gold spot price from Bloomberg; investment-grade excess return uses the Bloomberg Barclays US Agg Corporate Excess Return series; high yield excess return uses the Bloomberg Barclays US Corporate High Yield Excess Return series; emerging market currencies uses the MSCI Emerging Markets Currency Index; developed markets currencies is calculated using the the Nominal FRB Advanced Foreign Economies Trade-Weight Dollar Index.
3 It is important to note that our analysis does not measure drawdowns from the peak to the trough of the business cycle; it measures the month‑on‑month return of the asset in each of the five economic phases described above. Peak-to-trough drawdowns can extend over several economic phases and, therefore, tend to be more severe than drawdowns in each phase. Using different methodology could yield different results.
4 Emerging market carry trades typically involve borrowing U.S. dollars to invest in emerging market currencies.
Important Information
This material is provided for informational purposes only and is not intended to be investment advice or a recommendation to take any particular investment action.
The views contained herein are those of the authors as of June 2020 and are subject to change without notice; these views may differ from those of other T. Rowe Price associates.
This information is not intended to reflect a current or past recommendation, investment advice of any kind, or a solicitation of an offer to buy or sell any securities or investment services. The opinions and commentary provided do not take into account the investment objectives or financial situation of any particular investor or class of investor. Investors will need to consider their own circumstances before making an investment decision.
Information contained herein is based upon sources we consider to be reliable; we do not, however, guarantee its accuracy.
Past performance is not a reliable indicator of future performance. All investments are subject to market risk, including the possible loss of principal. Commodities are subject to increased risks such as higher price volatility, geopolitical and other risks. Fixed-income securities are subject to credit risk, liquidity risk, call risk, and interest-rate risk. As interest rates rise, bond prices generally fall. Investments in high-yield bonds involve greater risk of price volatility, illiquidity, and default than higher-rated debt securities. International investments can be riskier than U.S. investments due to the adverse effects of currency exchange rates, differences in market structure and liquidity, as well as specific country, regional, and economic development. These risks are generally greater for investments in emerging markets. All charts and tables are shown for illustrative purposes only. Index performance is for illustrative purposes only and is not indicative of any specific investment. Investors cannot invest directly in an index.
T. Rowe Price Investment Services, Inc.
© 2020 T. Rowe Price. All rights reserved. T. ROWE PRICE, INVEST WITH CONFIDENCE, and the bighorn sheep design are, collectively and/or apart, trademarks or registered trademarks of T. Rowe Price Group, Inc.

Weekly Investment Commentary: Munis offer yield relief from inflation’s heat
U.S. yields began the year at their highest starting level since 2011, and they have since risen further across the Treasury and municipal curves.

Global Weekly Commentary: Higher bar for U.S. earnings to deliver
We saw 2024 as a year of two stories. First, cooling inflation and solid corporate earnings would support upbeat risk appetite.

Global Markets Weekly Update: April 19, 2024
Review the performance of global stock and bond markets over the past week, along with relevant insights from T. Rowe Price economists and investment professionals.