
Weekly Fixed Income Commentary - Risk-on market tone boosts Treasury yields
Highlights
- Preferred securities and senior loans posted the highest returns.
- High yield municipals continued to benefit from favorable technical support.
- High yield corporates performed firmly, and spreads tightened by more than 20 basis points.
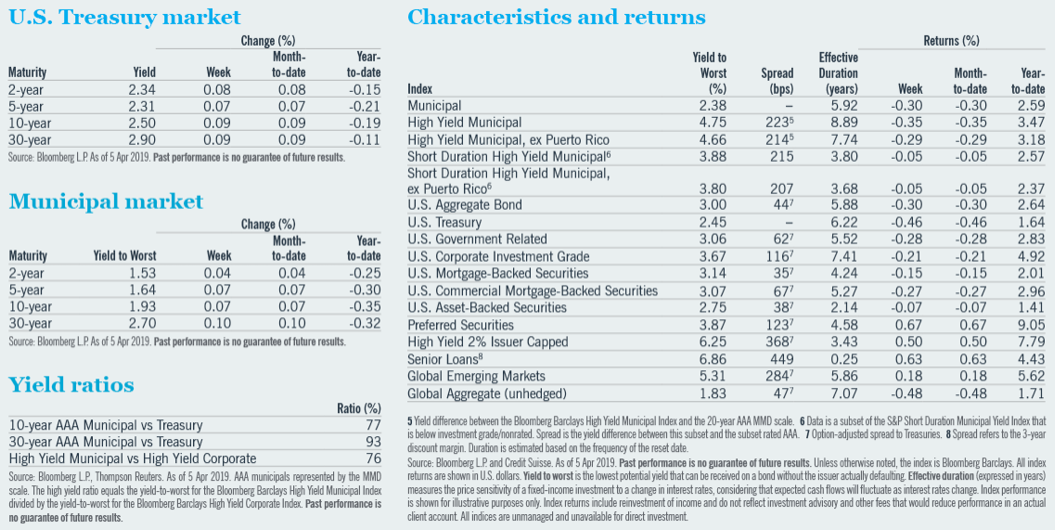
U.S. Treasury yields rose last week, led by 10- and 30-year maturities. Investors grew more optimistic about prospects for global growth, causing yields to rise and the yield curve to steepen. Favorable economic data in China pushed rates higher in overnight trading sessions Monday and Wednesday. Market expectations for a Federal Reserve (Fed) rate cut in 2019 fell steadily last week.
Treasury yields rise on improved global growth outlook
U.S. Treasury yields rose last week for all maturities, with 10- and 30-year rates increasing the most.1 A more optimistic outlook for global growth stoked a risk-on market tone that caused interest rates to rise and the yield curve to steepen. The move began Monday before the U.S. markets opened, as economic data in China pushed rates higher in overnight trading. In fact, overnight interest rate changes persisted through the following U.S. trading session every day except Friday.1 This indicates that investors were focused on global growth trends, especially in China and Europe. For example, stronger economic data in China pushed rates higher overnight on Monday and Wednesday, and these days saw the largest increases of the week.
All domestic sectors outperformed U.S. Treasuries, but only the higher-risk sectors delivered positive total returns for the week.1 Preferred securities finished highest, followed by senior loans.1 High yield corporates and emerging markets also enjoyed positive returns.1 Only the global aggregate sector suffered a lower total return than Treasuries, with Asian markets declining significantly.1 However, with strong relative returns from the non-Treasury areas of the market, even the global aggregate outperformed similar-duration Treasuries.1
The market-based probability of a Fed rate cut in 2019 fell steadily, though modestly, throughout last week. This pushed short maturity yields slightly higher, but not nearly as much as longer maturities.1 Consequently, the difference between 3-month and 10-year Treasury yields increased.1 The yield curve is now positively sloped, with the 10-year yield approximately 7 basis points higher than the 3-month bill.1
Municipal fund flows stand at $23.4 billion year to date, the best annual start since 1992.
Municipal demand off to a stellar start
The municipals market sold off last week, following U.S. Treasuries.1 However the selloff was orderly, and both markets closed the week with constructive tones. New issue supply was $7.6 billion and was readily absorbed.2 Weekly fund flows totaled $714 million, for the 13th consecutive week of positive flows.3 This week’s new issue supply is expected to be $6.7 billion.2 This includes a $2.3 billion state of California general obligation deal.4 The market should welcome new supply to meet the continuing demand.
Fixed income yields in general rose last week. This is not surprising as the previous week ended the first quarter, a quarter that provided strong returns. Investors are likely pausing to reestablish fair value levels. But the story remains the same: interest rates are generally expected to remain low, municipal supply continues to be constrained and demand remains strong. In fact, fund flows stand at $23.4 billion year to date, continuing the best annual start since data began to be collected in 1992.3
High yield municipals continued to benefit from favorable technical support last week. Fund flows remained firm at $320 million.3 The year’s biggest high yield municipal deal, Virgin Trains USA, priced with heavy subscriptions and heavy secondary demand.
Florida Development Finance Corporation issued $1.75 billion bonds for the Virgin Trains USA Passenger Rail Project, a light rail system in southern Florida.4 Bonds were issued at 6.5% tax-exempt yield (although bonds are subject to the alternative minimum tax). The deal broke to a premium immediately. This once again demonstrates the demand for revenue-backed projects in the U.S.
U.S. high yield and EM debt start the second quarter well
High yield corporate bonds traded firmly last week, helped by a constructive equity market and continued healthy demand from investors looking to pick up yield.1 Spreads tightened by more than 20 basis points, and inflows of approximately $2 billion marked the fourth consecutive week of positive flows into the high yield space.1,3 From a quality standpoint, BB rated bonds outperformed Bs and CCCs.1
Investment grade corporate bonds posted a small loss for the week despite modestly narrower spreads.1 Among sectors, autos saw the most spread compression, while utilities and energy lagged.1 Demand for U.S. credit got a boost from Asian buyers, including renewed interest from Japan. It was an active week for new supply, with 13 issuers pricing more than $14 billion of debt.2 Primary issuance is down year over year, however.
Inflows of approximately $2 billion marked the fourth consecutive week of positive flows into the high yield space.
Emerging markets (EM) debt began the second quarter on solid footing.1 Both sovereign and corporate EM issues performed well last week.1 Spreads narrowed and inflows into the asset class exceeded $1 billion.1,3 News that China’s manufacturing sector accelerated in March eased concerns over slowing global growth. Optimism from both sides of the U.S./ China trade negotiations also lifted spirits, particularly in Asia. EM local currencies were broadly resilient, led by the South African rand.
In focus: Inversion diversion: is it reversion or conversion?
In late March, the U.S. Treasury yield curve inverted, with the 3-month Treasury bill yield exceeding that of the 10-year Treasury bond for the first time since mid-2007.1 This relationship garnered significant attention, since the Fed and other forecasters view it as an accurate predictor of future recessions.
A yield curve inversion has typically occurred about one to two years prior to the onset of a recession. For instance, the 2001 and 2007 recessions were preceded by brief inversions lasting several days, followed by more protracted, deeper inversions and ultimately recessions.
Leading up to the 2001 recession, a short inversion lasted 3 days, reaching -8 basis points (bps) and occurring 12 months prior to the recession.1 A longer inversion began 8 months prior to the recession. This inversion lasted just over 6 months and troughed around -99 bps.1
In advance of the 2007 recession, an inversion lasted 7 days and bottomed at -6 bps, occurring 22 months before that recession.1 A longer inversion followed shortly after, at 17 months prior to that recession. This inversion lasted 10 months and bottomed at -59 bps.1
The recent inversion lasted 6 days and troughed at about -5 bps.1 The yield curve may well invert again in the future, but we do not anticipate a recession any sooner than 12 to 18 months from now.
1 Bloomberg L.P.
2 The Bond Buyer, 5 Apr 2019.
3 Lipper Fund Flows.
4 Market Insight, MMA Research, 3 Apr 2019.
Any reference to credit ratings refers to the highest rating given by one of the following national rating agencies: S&P, Moody’s or Fitch. Credit ratings are subject to change. AAA, AA, A and BBB are investment grade ratings; BB, B, CCC, CC, C and D are below-investment grade ratings.
Bloomberg Barclays Municipal Index covers the USD-denominated tax-exempt bond market. Bloomberg Barclays High Yield Municipal Index covers the USD-denominated, below investment grade tax-exempt bond market. S&P Short Duration Municipal Yield Index tracks the municipal bond market with maturities from 1 to 12 years. Bloomberg Barclays U.S. Aggregate Bond Index covers the U.S. investment grade fixed rate bond market. Bloomberg Barclays U.S. Treasury Index includes public obligations of the U.S. Treasury. Bloomberg Barclays U.S. Government-Related Index includes debt guaranteed, owned and sponsored by the U.S. government; it does not include debt directly issued by the U.S. government. Bloomberg Barclays U.S. Corporate Index is a broad-based benchmark that measures the investment grade, fixed-rate, taxable corporate bond market. Bloomberg Barclays U.S. Mortgage-Backed Securities Index is the MBS component of the U.S. Aggregate index and includes the mortgage-backed pass-through securities of Ginnie Mae (GNMA), Fannie Mae (FNMA), and Freddie Mac (FHLMC). Bloomberg Barclays CMBS ERISA-Eligible Index is the CMBS component of the U.S. Aggregate index and includes CMBS investment grade securities that are ERISA eligible under the underwriter’s exemption. Bloomberg Barclays Asset-Backed Securities Index is the ABS component of the U.S. Aggregate index and includes credit and charge cards, autos and utilities. ICE BofA Merrill Lynch U.S. All Capital Securities Index is a subset of the BofA Merrill Lynch U.S. Corporate Index including all fixed-to-floating rate, perpetual callable and capital securities. Bloomberg Barclays High Yield 2% Issuer Capped Index measures the market of USD-denominated, non-investment grade bonds and limits each issue to 2% of the index. The Credit Suisse Leveraged Loan Index is designed to mirror the investable universe of the U.S. dollar-denominated leveraged loan market. Loans are added to the index if they qualify according to the following criteria: The highest Moody’s/S&P ratings are Ba1/BBB+, only funded term loans are included, and the tenor must be at least one year. Bloomberg Barclays Emerging Market USD Aggregate Index is a flagship hard currency Emerging Markets debt benchmark that includes USD denominated debt from sovereign, quasi-sovereign, and corporate EM issuers. Bloomberg Barclays Global Aggregate Unhedged Index measures the performance of global bonds. It includes government, securitized and corporate sectors and does not hedge currency. One basis point equals .01%, or 100 basis points equal 1%
A word on risk
Investing involves risk; principal loss is possible. Debt or fixed income securities are subject to market risk, credit risk, interest rate risk, call risk, derivatives risk, dollar roll transaction risk and income risk. As interest rates rise, bond prices fall. Below investment grade or high yield debt securities are subject to liquidity risk and heightened credit risk. Preferred securities are subordinated to bonds and other debt instruments in a company’s capital structure and therefore are subject to greater credit risk. Foreign investments involve additional risks, including currency fluctuation, political and economic instability, lack of liquidity and differing legal and accounting standards. Asset-backed and mortgage-backed securities are subject to additional risks such as prepayment risk, liquidity risk, default risk and adverse economic developments. The value of convertible securities may decline in response to such factors as rising interest rates and fluctuations in the market price of the underlying securities. Senior loans are subject to loan settlement risk due to the lack of established settlement standards or remedies for failure to settle. These investments are subject to credit risk and potentially limited liquidity, as well as interest rate risk, currency risk, prepayment and extension risk, and inflation risk.
Investors should contact a tax advisor regarding the suitability of tax-exempt investments in their portfolio. If sold prior to maturity, municipal securities are subject to gain/losses based on the level of interest rates, market conditions and the credit quality of the issuer. Income may be subject to the alternative minimum tax (AMT) and/or state and local taxes, based on the state of residence. Income from municipal bonds held by a portfolio could be declared taxable because of unfavorable changes in tax laws, adverse interpretations by the Internal Revenue Service or state tax authorities, or noncompliant conduct of a bond issuer. It is important to review your investment objectives, risk tolerance and liquidity needs before choosing an investment style or manager.
This information represents the opinion of Nuveen, LLC and its affiliates and is not intended to be a forecast of future events and or guarantee of any future result. Information was obtained from third party sources which we believe to be reliable but are not guaranteed as to their accuracy or completeness. There is no assurance that an investment will provide positive performance over any period of time
The investment advisory services, strategies and expertise of TIAA Investments, a division of Nuveen, are provided by Teachers Advisors, LLC and TIAA-CREF Investment Management, LLC. Nuveen Asset Management, LLC, Symphony Asset Management LLC and NWQ Investment Management Company LLC are registered investment advisers and affiliates of Nuveen, LLC.

Weekly Investment Commentary: Munis offer yield relief from inflation’s heat
U.S. yields began the year at their highest starting level since 2011, and they have since risen further across the Treasury and municipal curves.

Global Weekly Commentary: Higher bar for U.S. earnings to deliver
We saw 2024 as a year of two stories. First, cooling inflation and solid corporate earnings would support upbeat risk appetite.

Global Markets Weekly Update: April 19, 2024
Review the performance of global stock and bond markets over the past week, along with relevant insights from T. Rowe Price economists and investment professionals.