
Weekly Fixed Income Commentary: Treasury yields decline over global growth concerns
Highlights
- Preferred securities, investment grade corporates and high yield corporates outperformed similar-duration Treasuries.
- The municipal market closed higher, supported by outsized new issue supply.
- Investment grade corporates outperformed all other taxable fixed income sectors.
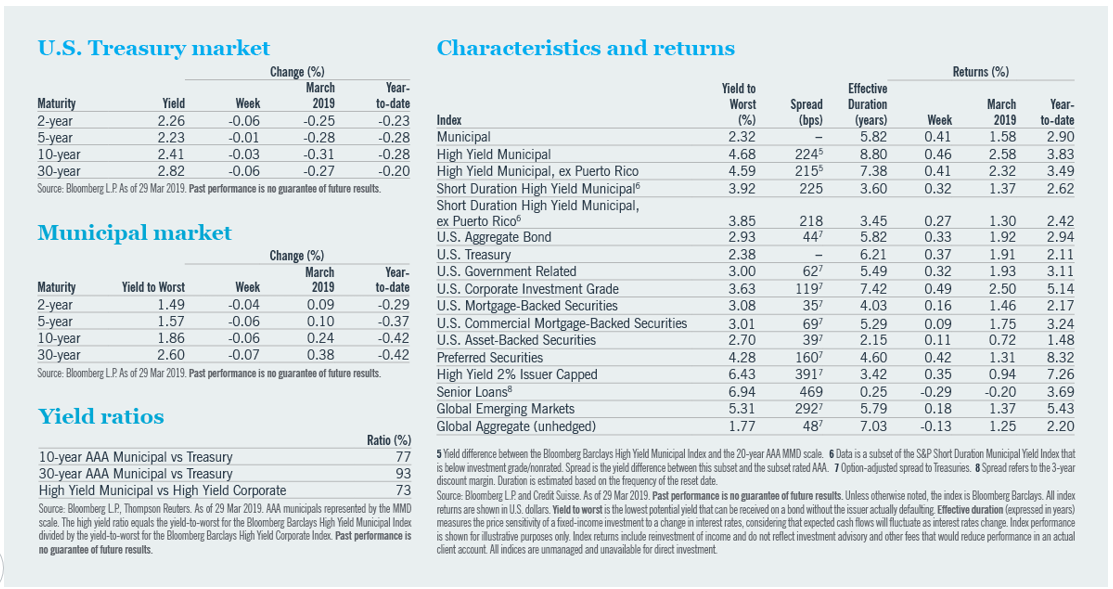
U.S. Treasury yields declined across the curve last week, led by 30- year maturities. The drop was due in part to continued concerns over global growth. The 3-month/10-year yield curve inversion abated, but the curve may invert again in the near future. The market is split on whether the next Federal Reserve (Fed) move will be a rate hike or cut.
Credit sectors post strong first quarter performance
U.S. Treasury yields declined across the curve last week, led by 30-year maturities.1The overall decline masks the week’s volatility, as rates changed direction almost daily. Rates were driven lower by continuing global growth concerns and Treasury demand related to mortgage portfolio hedging. Treasury yields rose in the final two trading days due to growing optimism over a U.S./China trade deal.1
All U.S. fixed income sectors except senior loans delivered positive total returns last week.1 However, only preferred securities, investment grade corporates and high yield corporates outperformed similar-duration Treasuries, capping off a strong first quarter.1 Preferred securities outperformed
Treasuries by 642 basis points (bps) in the first quarter, nearly offsetting the -724 bps underperformance in the fourth quarter of 2018.1 Emerging markets posted positive total returns, but underperformed Treasuries.1 The global aggregate sector showed negative total return and underperformed Treasuries, driven by the Pan-European region.
The yield curve inversion between the 3-month and 10-year areas abated last week. But the difference in yields is just shy of one basis point, so the yield curve may invert again in the near future. Given the rally in risk assets last week, it appears the market has lowered the its expectations for a near-term recession. Nevertheless, fixed income markets continue to price in a high likelihood of a Fed rate cut by the end of the year.
The market is split 50/50 on whether the next Fed move will be a rate hike or a cut.
Outsized new issue supply boosts municipal market
The municipal and Treasury markets both closed higher for the week, but municipals underperformed Treasuries.1 Municipal new issue supply was $9.2 billion and was well received.2 Demand continued to be strong, as fund flows totaled $1.5 billion.3 This week’s new issue supply is expected to be $7.3 billion.2 Outsized new issue supply helped the market, as institutional investors were finally able to access large blocks of bonds to invest newly received cash.
The municipal market ended the first quarter with impressive performance.1 We expect this positive tone to continue. The market is split 50/50 on whether the next Fed move will be a rate hike or a cut. New issue supply continues to be constrained, while demand is robust.
The state of Connecticut issued $600 million tax-exempt general obligation bonds, in addition to taxable bonds (rated A1/A).4 The deal was well received, and yields were lowered as much as 15 bps in some maturities upon final pricing. A new administration in the state has pledged to be more fiscally responsible, in an effort to help Connecticut continue to regain the premier trading status it once enjoyed.
High yield municipal bond prices appreciated last week, as ratios compressed and credit spreads contracted.1 Historically strong inflows continued last week, at $491 million.3 Supply is trending higher but still insufficient to meet the market’s appetite. Last week’s $700 million Chicago general obligation and $120 million Iowa Fertilizer deals were heavily oversubscribed.4 We believe Virgin Trains USA is likely to become a benchmark high yield municipal bond with a $1.5 billion issuance and the potential for more to finance additional phases.4
U.S. corporate debt ends the quarter on an upbeat note
Investment grade corporate bonds outperformed all taxable fixed income sectors for the second week in a row and for the month of March.1 The asset class also fared well during the first quarter, generating positive returns in 11 of 13 weeks.1 Investment grade credit spreads bounced around last week before finishing unchanged. The primary market was active, with 26 issuers pricing nearly $28 billion in new supply.2
High yield corporates added to their first quarter results.1 The market tone for high yield was mixed last week, marked by further inflows, slightly narrower spreads and a third consecutive week of gains—but also light trading volumes and losses in more than 40% of industry sectors.1 Diversified media, chemicals and restaurants were the worst performers, while non-air transportation, retail and broadcasters were the best.1 BB rated securities outpaced Bs and CCCs.1 New issue volume exceeded $3 billion.2
Non-air transportation, retail and broadcasters were the best-performing high yield sectors.
Emerging markets (EM) managed a modest gain.1 Global growth concerns roiled EM debt for much of the week, as the U.S. yield curve inversion stoked fears of a recession. Higher yielding EM countries bore the brunt of mid-week volatility, reflecting Turkey’s liquidity crunch, political noise over pension reform in Brazil and a combination of persistently high inflation and ongoing economic weakness in Argentina. EM conditions were generally calmer by Friday, aiding full-week performance.
In focus: Municipal technicals support performance
Municipal market technicals show strong demand and weaker supply so far in 2019. This relationship is supporting municipal market performance, and we believe this trend will continue throughout 2019.
New issue supply has totaled $71.9 billion so far in 2019, significantly lower than the average first quarter supply of $82.2 billion from 2014 to 2018.2 First quarter 2018 new issuance was unusually light due to tax law changes that prohibit tax-exempt pre-refundings of tax-exempt bonds. This year’s total new issue supply may indicate the new normal, with the absence of advance refunding activity. New money issuance continues to trend higher in 2019 year over year, a sign of a healthy municipal market.
On the demand side, first quarter municipal fund net inflows were robust at $23 billion, one of the strongest first quarters since the Great Recession.3 Investors are reassessing the benefits of fixed income in a diversified portfolio, and changes in state and local tax (SALT) deductions remain a factor for investors in high-tax states.
Yield spreads for high-tax states versus national have tightened, as those investors find value in owning in state bonds to benefit from double tax-exempt interest income.
1 Bloomberg L.P.
2 The Bond Buyer, 29 Mar 2019.
3 Lipper Fund Flows.
4 Market Insight, MMA Research, 27 Mar 2019.
Any reference to credit ratings refers to the highest rating given by one of the following national rating agencies: S&P, Moody’s or Fitch. Credit ratings are subject to change. AAA, AA, A and BBB are investment grade ratings; BB, B, CCC, CC, C and D are below-investment grade ratings.
Bloomberg Barclays Municipal Index covers the USD-denominated tax-exempt bond market. Bloomberg Barclays High Yield Municipal Index covers the USD-denominated, below investment grade tax-exempt bond market. S&P Short Duration Municipal Yield Index tracks the municipal bond market with maturities from 1 to 12 years. Bloomberg Barclays U.S. Aggregate Bond Index covers the U.S. investment grade fixed rate bond market. Bloomberg Barclays U.S. Treasury Index includes public obligations of the U.S. Treasury. Bloomberg Barclays U.S. Government-Related Index includes debt guaranteed, owned and sponsored by the U.S. government; it does not include debt directly issued by the U.S. government. Bloomberg Barclays U.S. Corporate Index is a broad-based benchmark that measures the investment grade, fixed-rate, taxable corporate bond market. Bloomberg Barclays U.S. Mortgage-Backed Securities Index is the MBS component of the U.S. Aggregate index and includes the mortgage-backed pass-through securities of Ginnie Mae (GNMA), Fannie Mae (FNMA), and Freddie Mac (FHLMC). Bloomberg Barclays CMBS ERISA-Eligible Index is the CMBS component of the U.S. Aggregate index and includes CMBS investment grade securities that are ERISA eligible under the underwriter’s exemption. Bloomberg Barclays Asset-Backed Securities Index is the ABS component of the U.S. Aggregate index and includes credit and charge cards, autos and utilities. ICE BofA Merrill Lynch U.S. All Capital Securities Index is a subset of the BofA Merrill Lynch U.S. Corporate Index including all fixed-to-floating rate, perpetual callable and capital securities. Bloomberg Barclays High Yield 2% Issuer Capped Index measures the market of USD-denominated, non-investment grade bonds and limits each issue to 2% of the index. The Credit Suisse Leveraged Loan Index is designed to mirror the investable universe of the U.S. dollar-denominated leveraged loan market. Loans are added to the index if they qualify according to the following criteria: The highest Moody’s/S&P ratings are Ba1/BBB+, only funded term loans are included, and the tenor must be at least one year. Bloomberg Barclays Emerging Market USD Aggregate Index is a flagship hard currency Emerging Markets debt benchmark that includes USD denominated debt from sovereign, quasi-sovereign, and corporate EM issuers. Bloomberg Barclays Global Aggregate Unhedged Index measures the performance of global bonds. It includes government, securitized and corporate sectors and does not hedge currency. One basis point equals .01%, or 100 basis points equal 1%
A word on risk
Investing involves risk; principal loss is possible. Debt or fixed income securities are subject to market risk, credit risk, interest rate risk, call risk, derivatives risk, dollar roll transaction risk and income risk. As interest rates rise, bond prices fall. Below investment grade or high yield debt securities are subject to liquidity risk and heightened credit risk. Preferred securities are subordinated to bonds and other debt instruments in a company’s capital structure and therefore are subject to greater credit risk. Foreign investments involve additional risks, including currency fluctuation, political and economic instability, lack of liquidity and differing legal and accounting standards. Asset-backed and mortgage-backed securities are subject to additional risks such as prepayment risk, liquidity risk, default risk and adverse economic developments. The value of convertible securities may decline in response to such factors as rising interest rates and fluctuations in the market price of the underlying securities. Senior loans are subject to loan settlement risk due to the lack of established settlement standards or remedies for failure to settle. These investments are subject to credit risk and potentially limited liquidity, as well as interest rate risk, currency risk, prepayment and extension risk, and inflation risk.
Investors should contact a tax advisor regarding the suitability of tax-exempt investments in their portfolio. If sold prior to maturity, municipal securities are subject to gain/losses based on the level of interest rates, market conditions and the credit quality of the issuer. Income may be subject to the alternative minimum tax (AMT) and/or state and local taxes, based on the state of residence. Income from municipal bonds held by a portfolio could be declared taxable because of unfavorable changes in tax laws, adverse interpretations by the Internal Revenue Service or state tax authorities, or noncompliant conduct of a bond issuer. It is important to review your investment objectives, risk tolerance and liquidity needs before choosing an investment style or manager.
This information represents the opinion of Nuveen, LLC and its affiliates and is not intended to be a forecast of future events and or guarantee of any future result. Information was obtained from third party sources which we believe to be reliable but are not guaranteed as to their accuracy or completeness. There is no assurance that an investment will provide positive performance over any period of time
The investment advisory services, strategies and expertise of TIAA Investments, a division of Nuveen, are provided by Teachers Advisors, LLC and TIAA-CREF Investment Management, LLC. Nuveen Asset Management, LLC, Symphony Asset Management LLC and NWQ Investment Management Company LLC are registered investment advisers and affiliates of Nuveen, LLC.

Weekly Investment Commentary: Munis offer yield relief from inflation’s heat
U.S. yields began the year at their highest starting level since 2011, and they have since risen further across the Treasury and municipal curves.

Global Weekly Commentary: Higher bar for U.S. earnings to deliver
We saw 2024 as a year of two stories. First, cooling inflation and solid corporate earnings would support upbeat risk appetite.

Global Markets Weekly Update: April 19, 2024
Review the performance of global stock and bond markets over the past week, along with relevant insights from T. Rowe Price economists and investment professionals.